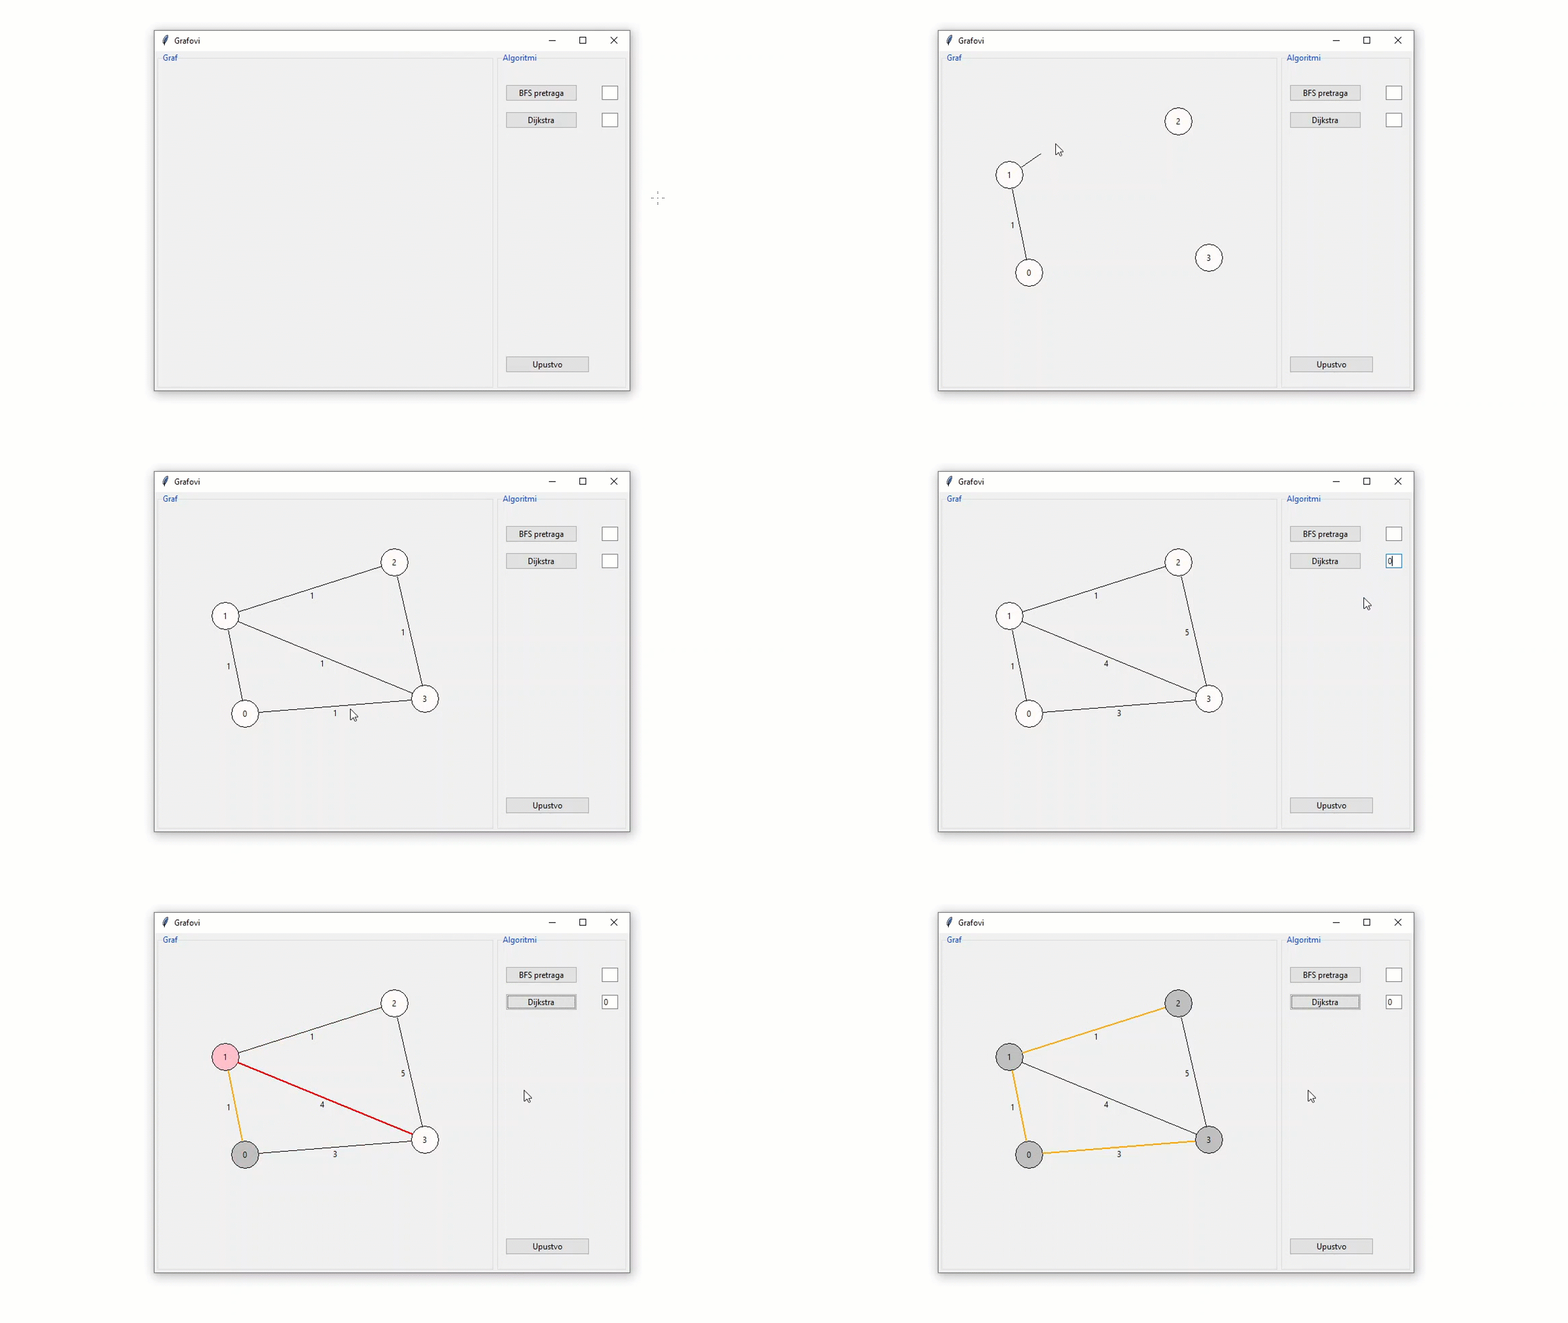
Built with vanilla Python 3, using tkinter as a GUI library, this project implements a visual simulation of most popular graph traversals/algorithms 🌐
Python 3 is all you need to get started. After cloning the repo, starting main file with python3 main.py will launch the application. This project was built with modularity in mind, and so it allows for easy addition of new algorithms. Take a look at existing ones and you'll see just how easy it is!
GUI Features include:
- Adding new nodes: left click anywhere on canvas
- Connecting nodes: Right click on an existing node and while holding right click, drop the line on another node
- Setting edge weights: hovering mouse over edge cost and typing a new numeric value
Future updates may include new algorithms, better UI Design, more graph drawing features, random graph generation, import/export options.
You're more than welcome to help out!
