
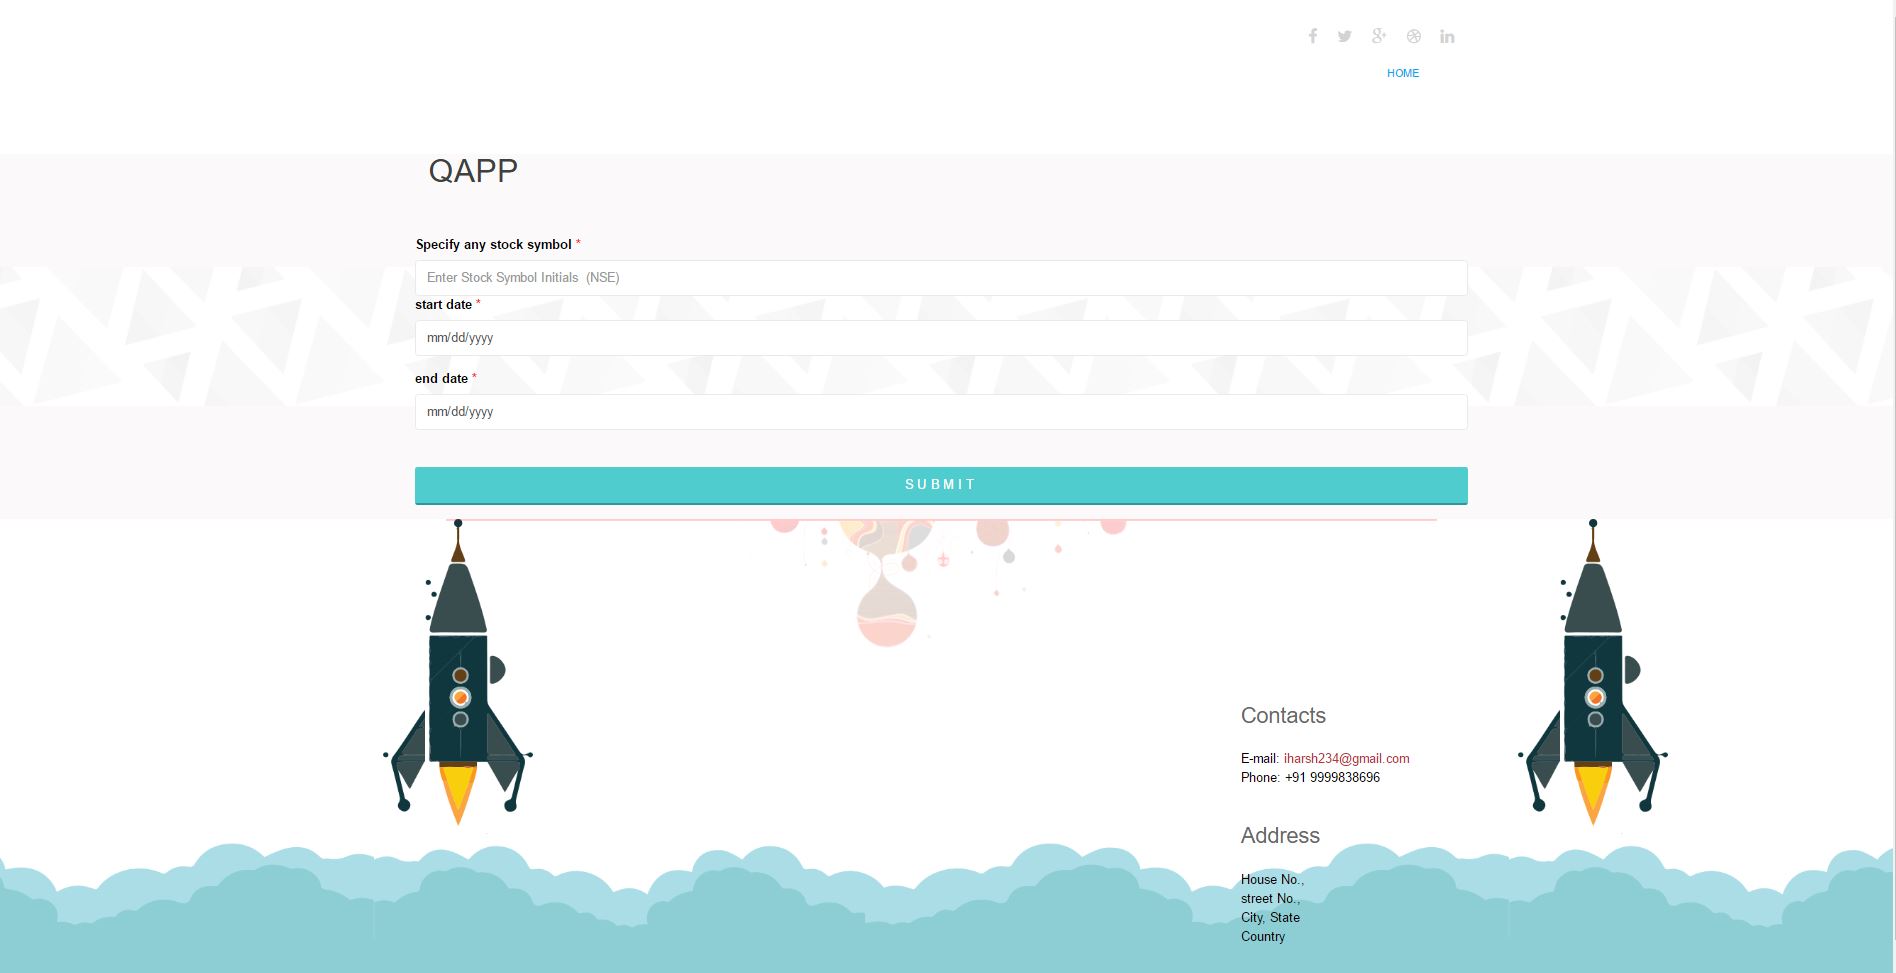
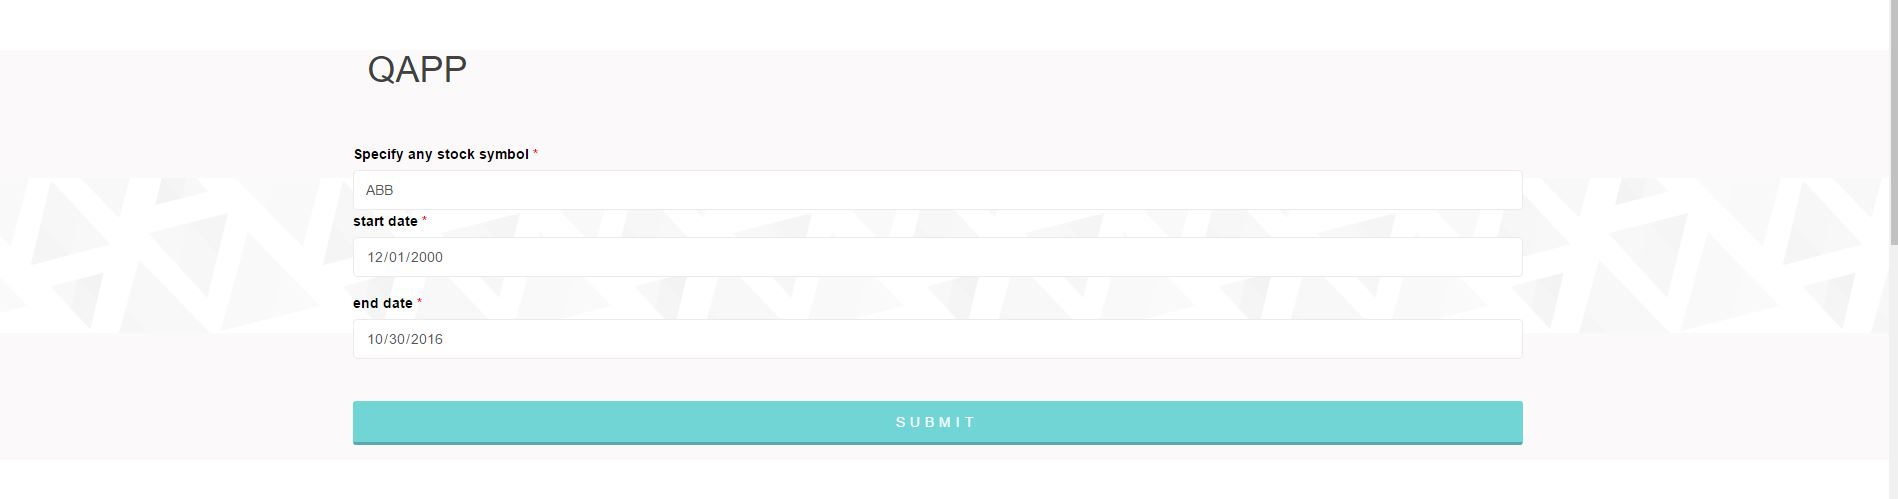
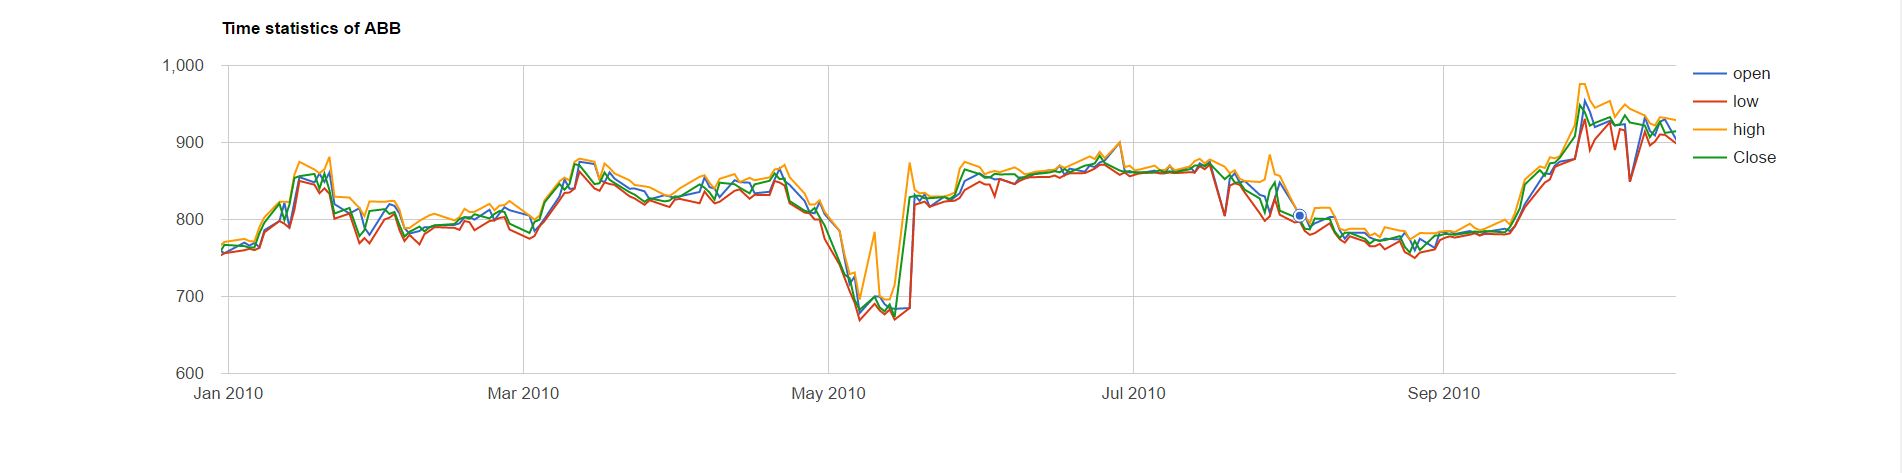
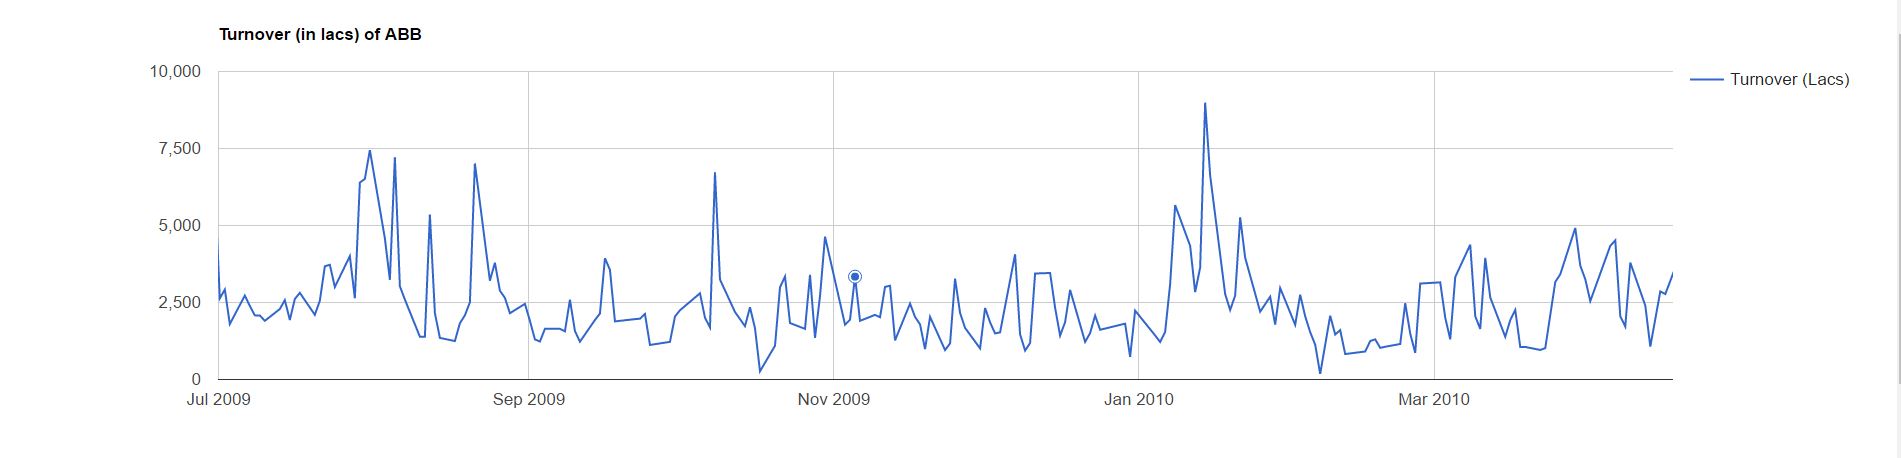
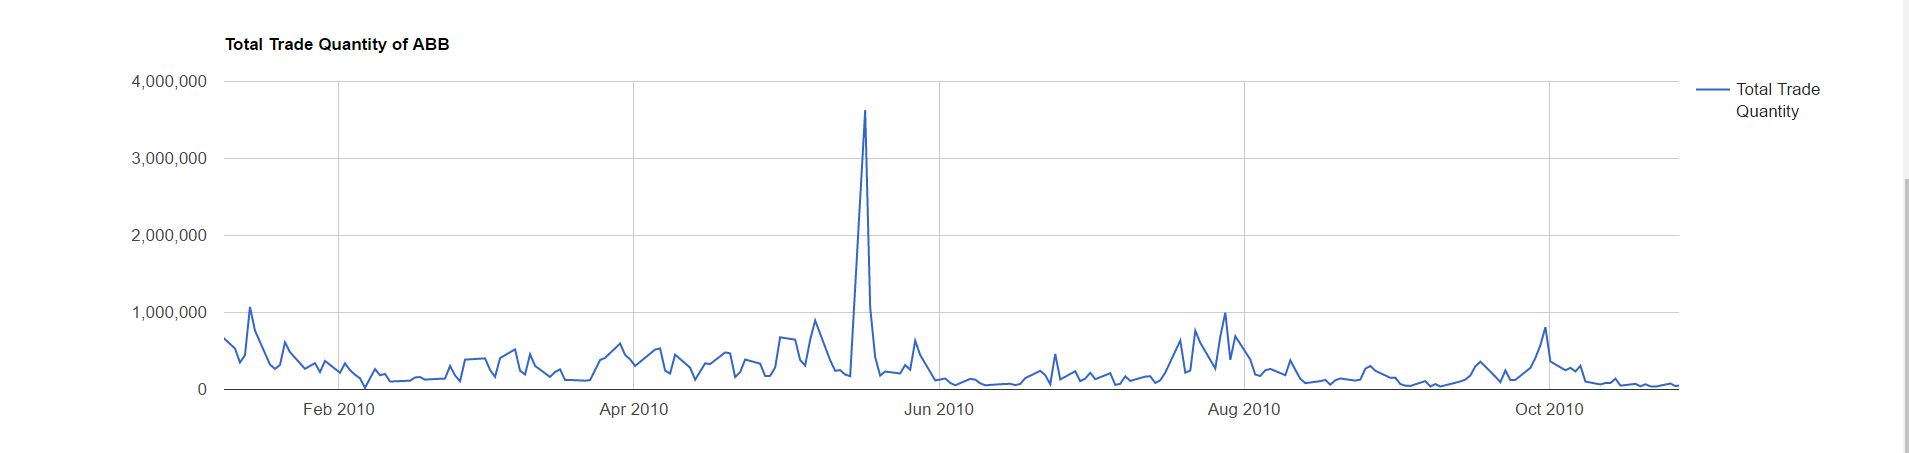
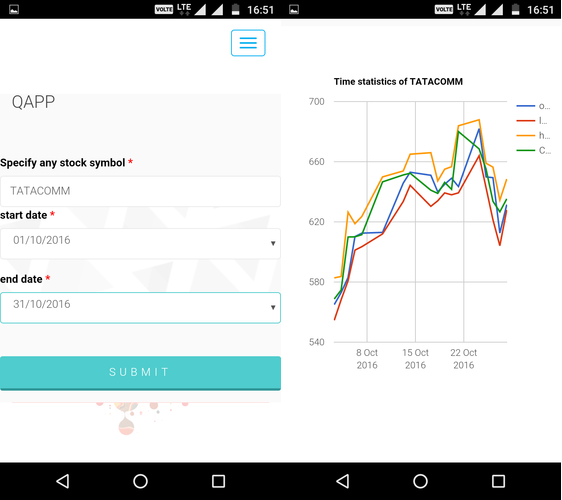
| A webapp using Quandl API to tell stock growth history in a given period and helps user predicting stocks future growth by seeing charts of stock performace in any period of time.Helps you judge stocks with principle of Momentum investing which gives average returns of 1% per month. |
You can test a fully working live demo at https://iharsh234.github.io/WebApp/
Currently its working on all NSE (India) Stocks and will Add all BSE (India) Stocks Symbol soon.
The WebApp is usable on devices of all sizes, and improvements are constantly being made in this area.
Want to contribute? Great!
To fix a bug or enhance an existing module, follow these steps:
- Fork the repo
- Create a new branch (
git checkout -b improve-feature) - Make the appropriate changes in the files
- Add changes to reflect the changes made
- Commit your changes (
git commit -am 'Improve feature') - Push to the branch (
git push origin improve-feature) - Create a Pull Request
If you find a bug (the website couldn't handle the query and / or gave irrelevant results), kindly open an issue here by including your search query and the expected result.
If you'd like to request a new functionality, feel free to do so by opening an issue here including some sample queries and their corresponding results.
- jQuery - Ajax - jQuery simplifies HTML document traversing, event handling, animating, and Ajax interactions for rapid web development.
- Google Chart API - Free , Rich Gallery , Customizable and Cross-browser compatible.
- Bootstrap - Extensive list of components and Bundled Javascript plugins.
- Adding BSE (India) Symbol to current App.
- Deciding Comparison models of Stocks. (suggestion are most welcome).
- Another WebApp Doing Comparision between atleast 10 Stocks.
 |
|
|---|---|
| Harsh Vijay | Quandl |
MIT © Harsh Vijay