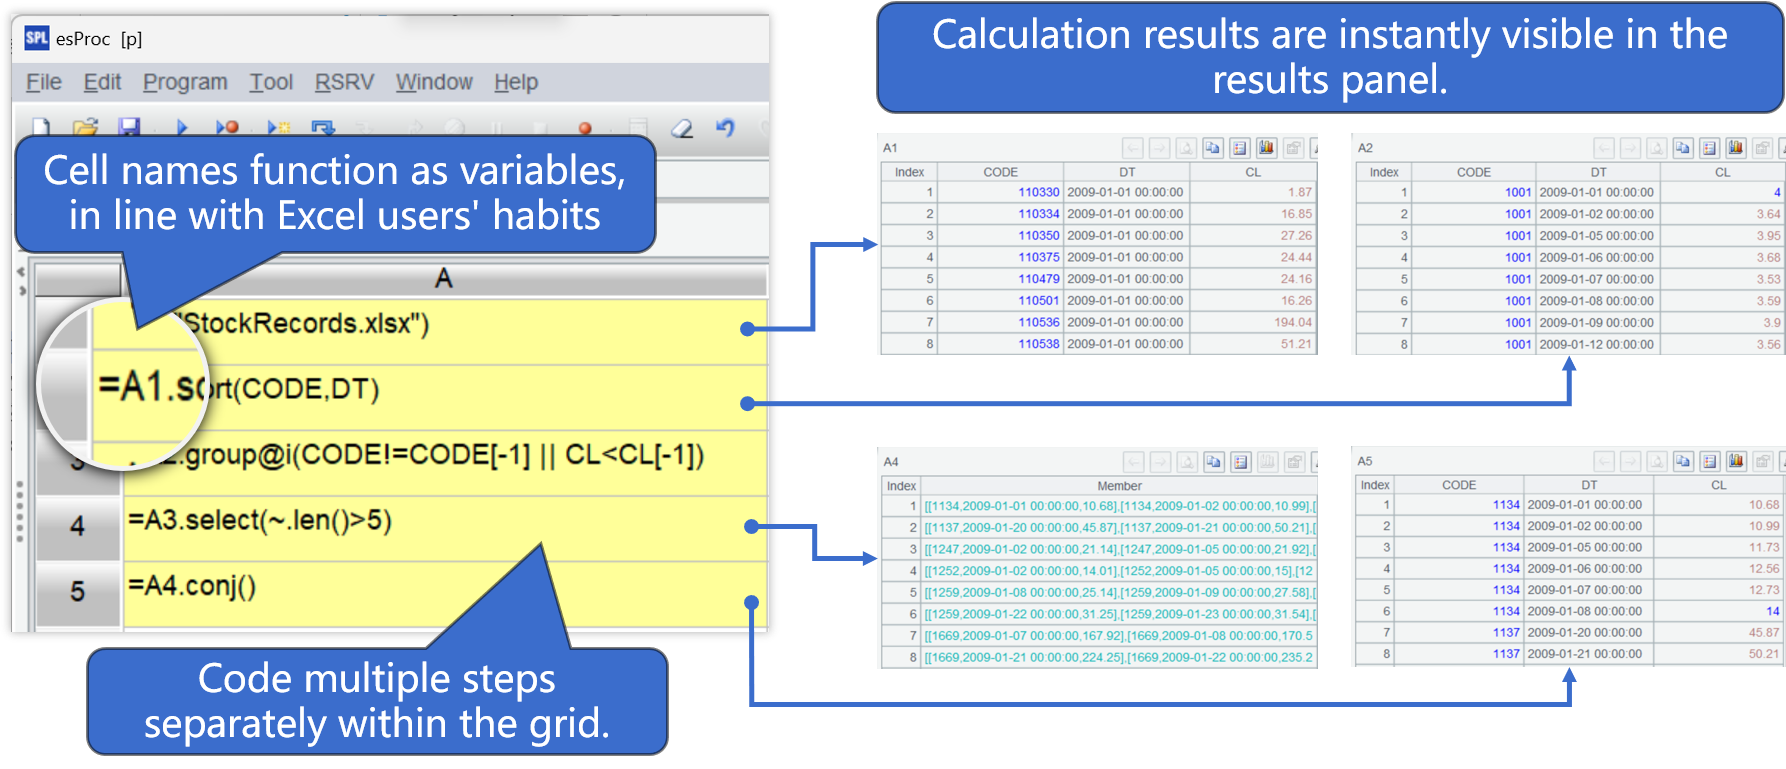


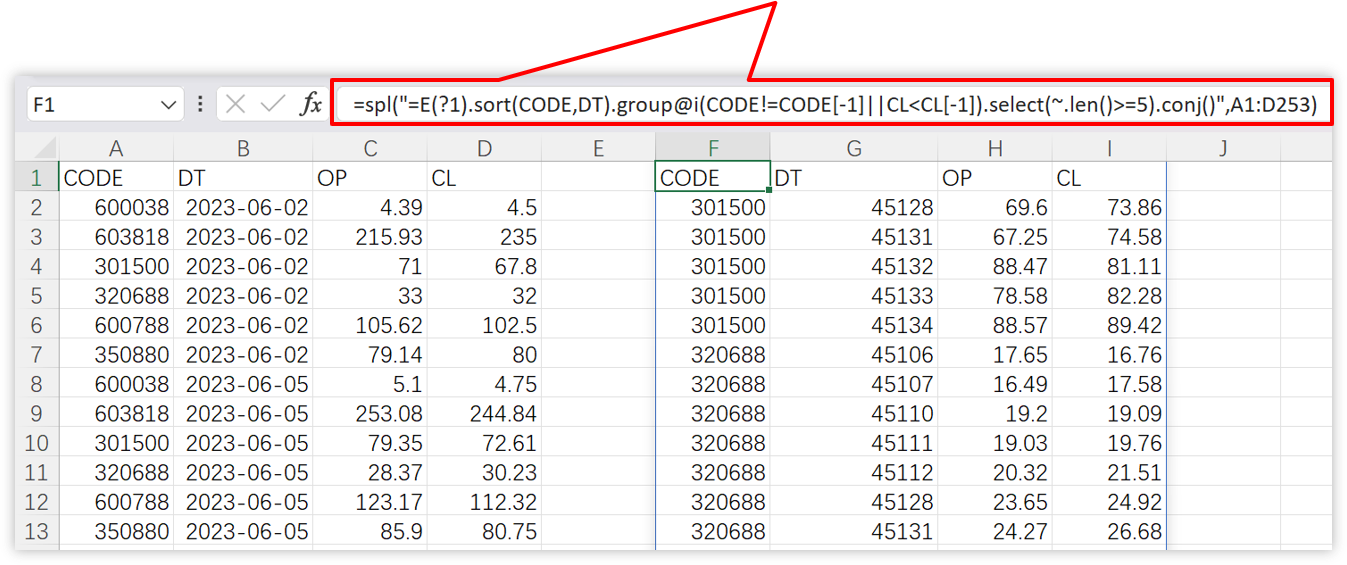
Write SPL code in Excel directly
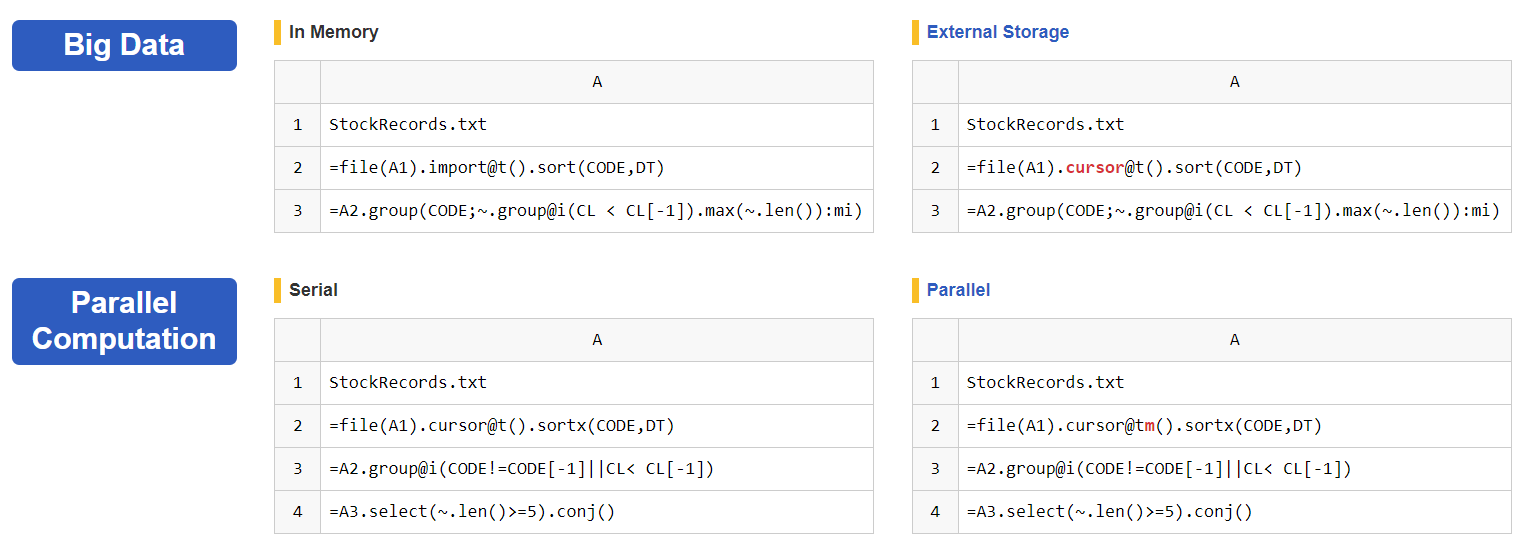
Finding periods during which stocks have risen consecutively for more than 5 days
=spl("=E(?1).sort(CODE,DT).group@i(CODE!=CODE[-1]||CL<CL[-1]).select(~.len()>=5).conj()",A1:D253)
calculate the longest consecutive rising days for each stock
SELECT CODE, MAX(con_rise) AS longest_up_days
FROM (
    SELECT CODE, COUNT(*) AS con_rise
    FROM (
        SELECT CODE, DT,  SUM(updown_flag) OVER (PARTITION BY CODE ORDER BY CODE, DT) AS no_up_days
        FROM (
            SELECT CODE, DT,
                    CASE WHEN CL > LAG(CL) OVER (PARTITION BY CODE ORDER BY CODE, DT)  THEN 0
                    ELSE 1 END AS updown_flag
            FROM stock
        )
    )
    GROUP BY CODE, no_up_days
)
GROUP BY CODEimport pandas as pd
stock_file = "StockRecords.txt"
stock_info = pd.read_csv(stock_file,sep="\t")
stock_info.sort_values(by=['CODE','DT'],inplace=True)
stock_group = stock_info.groupby(by='CODE')
stock_info['label'] = stock_info.groupby('CODE')['CL'].diff().fillna(0).le(0).astype(int).cumsum()
max_increase_days = {}
for code, group in stock_info.groupby('CODE'):
max_increase_days[code] = group.groupby('label').size().max() – 1
max_rise_df = pd.DataFrame(list(max_increase_days.items()), columns=['CODE', 'max_increase_days'])| A | |
|---|---|
| 1 | StockRecords.xlsx |
| 2 | =T(A1).sort(DT) |
| 3 | =A2.group(CODE;~.group@i(CL< CL[-1]).max(~.len()):max_increase_days) |
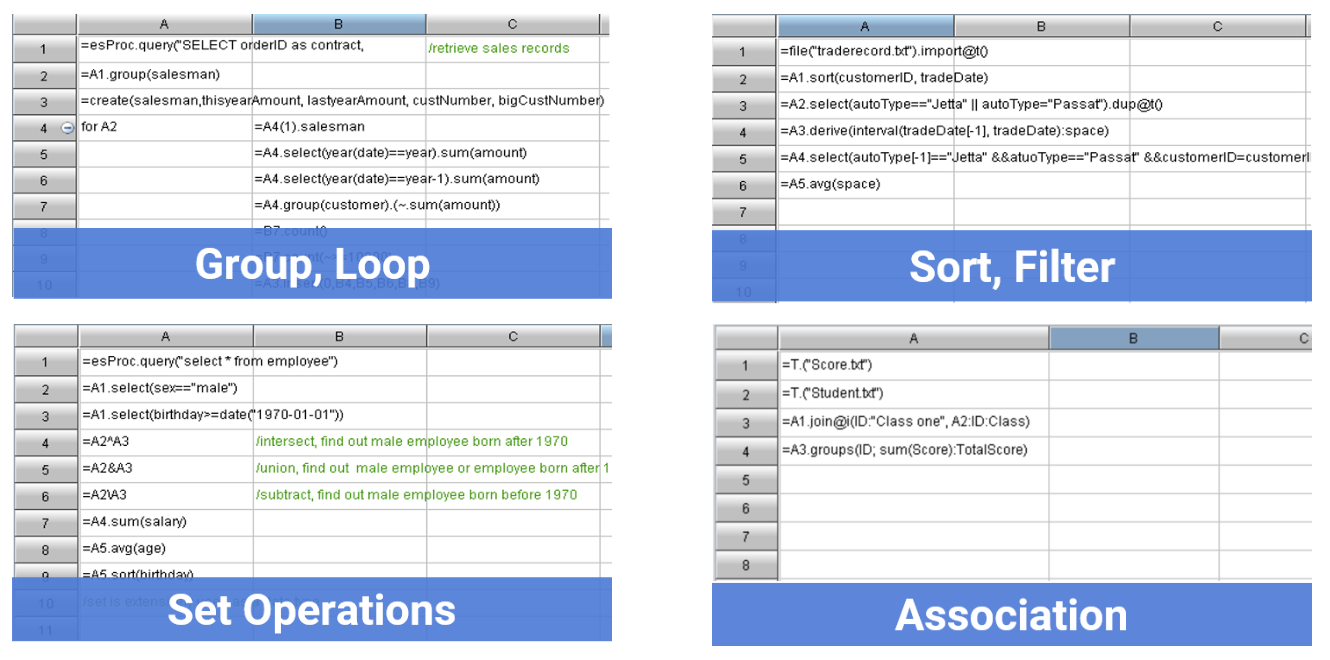
Especially skilled at complex scenarios such as order-related operations, sliding windows, and cross-row computations, much simpler than SQL or Python
What to use for data analysis programming: SPL,Python or SPL?