See the website.
News & Updates on the OSM Town Mapstodon.
- Fedi/Mastodon post
- OSM Community Forum
- Hacker News: #1 (2023-08-30) (as “OSM River Basins”), #2 (2024-01-24), #3 (2024-08-19)
- I gave a lightening talk at State of the Map Europe 2023 in Antwerp, Belgium in Nov. 2023. slides.
- “Flowing Connections: Mapping rivers & streams with WaterwayMap.org” Presentation at State of the Map Europe 2024 in Łódź, Poland on Sun. 21st July 2024. slides. programme entry. As of Jan. 2025, there are no recordings available.
- Interview about WaterwayMap.org on The OpenCage Blog (Jan. 2025)
- neis-one
#WaterwayMapOrg(older#RiverMappingtag). - OSMCha
#WaterwayMapOrg(older#RiverMappingon OSMCha)
- Should river lines be mapped through lakes, estuaries, gulfs, and other large water bodies? (Oct. 2023)
- Flowlines tagging proposal. osm comm. forum &
tagging@.
- Flowlines tagging proposal. osm comm. forum &
- Properly mapping dry washes (Jan. 2024)
- Is there a common tag for underground infiltrated watercourses? (Apr. 2024)
- How to map a Lazy river in an amusement park (May 2024)
- RfC: Deprecate use of “waterway=pressurised” on anything not artificially built for hydropower uses (June 2024)
- All posts tagged
#waterwaymaporg, or#waterwayon the OSM Community Forum.
Loops in waterways are detected and shown on:
WaterwayMap.org/loops.
Points at which waterways end are shown on: WaterwayMap.org/ends.
To detect places where waterways (e.g. rivers) flow into a stream, a GeoJSON file of those is generated: data.waterwaymap.org/planet-waterway-stream-ends.geojson.gz (~ 2 MiB compressed). It can be loaded into JOSM to find errors.
It was asked for in issue 52, with the code in commit 4730275.
A CSV file of statistics of loops is generated and available for download at
data.waterwaymap.org/waterwaymap.org_loops_stats.csv. See the
osm-lump-ways documentation on the CSV stats
file
for documentation.
It is used by @[email protected] for a
mastodon account summarizing stats:
@[email protected]
feed
A CSV statistics file of end points, is also generated dails and downloadable at
data.waterwaymap.org/waterwaymap.org_ends_stats.csv.zst.
See the osm-lump-ways
documentation
for file format.
If you like WaterwayMap.org, you might like the following other websites:
- Global Watersheds (mheberger/delineator on github)
- RiverMap.online
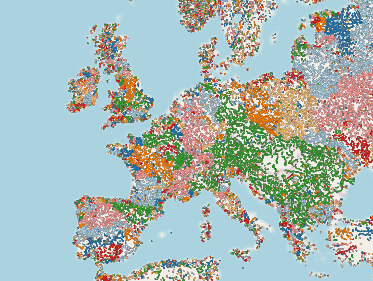
The colours are randomly assigned, and based on the final destination of the river. Everything that flows into the same point, gets the same colour. If you click the settings, you can change the number of colours. This can be useful to try to differentiate 2 different river networks.
The thickness of the lines is based on how many kilometres of river are upstream of that segment. The flow rate of a river is based on many things, such as the width of a river, and obviously changes a lot based on rainfall! I only use OpenStreetMap data, which rarely has width, and wouldn't have real-time data about the amount of water flowing through a point! What it does show (“how many waterways in total are upstream of here?”) will probably correlate with the flow rate, and is probably good enough for making a map, but you shouldn't use to see if your house is going to flood!
If a natural waterway runs through a lake, is it possible to show all the branches as connected waterways?
Currently, the only way to do this is map a waterway though the water body.
There is currently no other way to do it. The OSM community is a little
uncertain if this is always a good idea. There is a community
discussion.
There is a new tag
waterway=flowline
as possible tag to use for these ways through waterbodies.
I did try to add a map view which would include the edges of waterbodies,
e.g.
but that didn't work as well, because it only uses ways not relations, so
many water bodies weren't included.
However, the latest new feature, the River Directory, could benefit from relation support. So I might add that. cf..
Copyright MIT or Apache-2.0, 2017→2024 Amanda McCann [email protected]
Initially this project was called osm-river-basins.