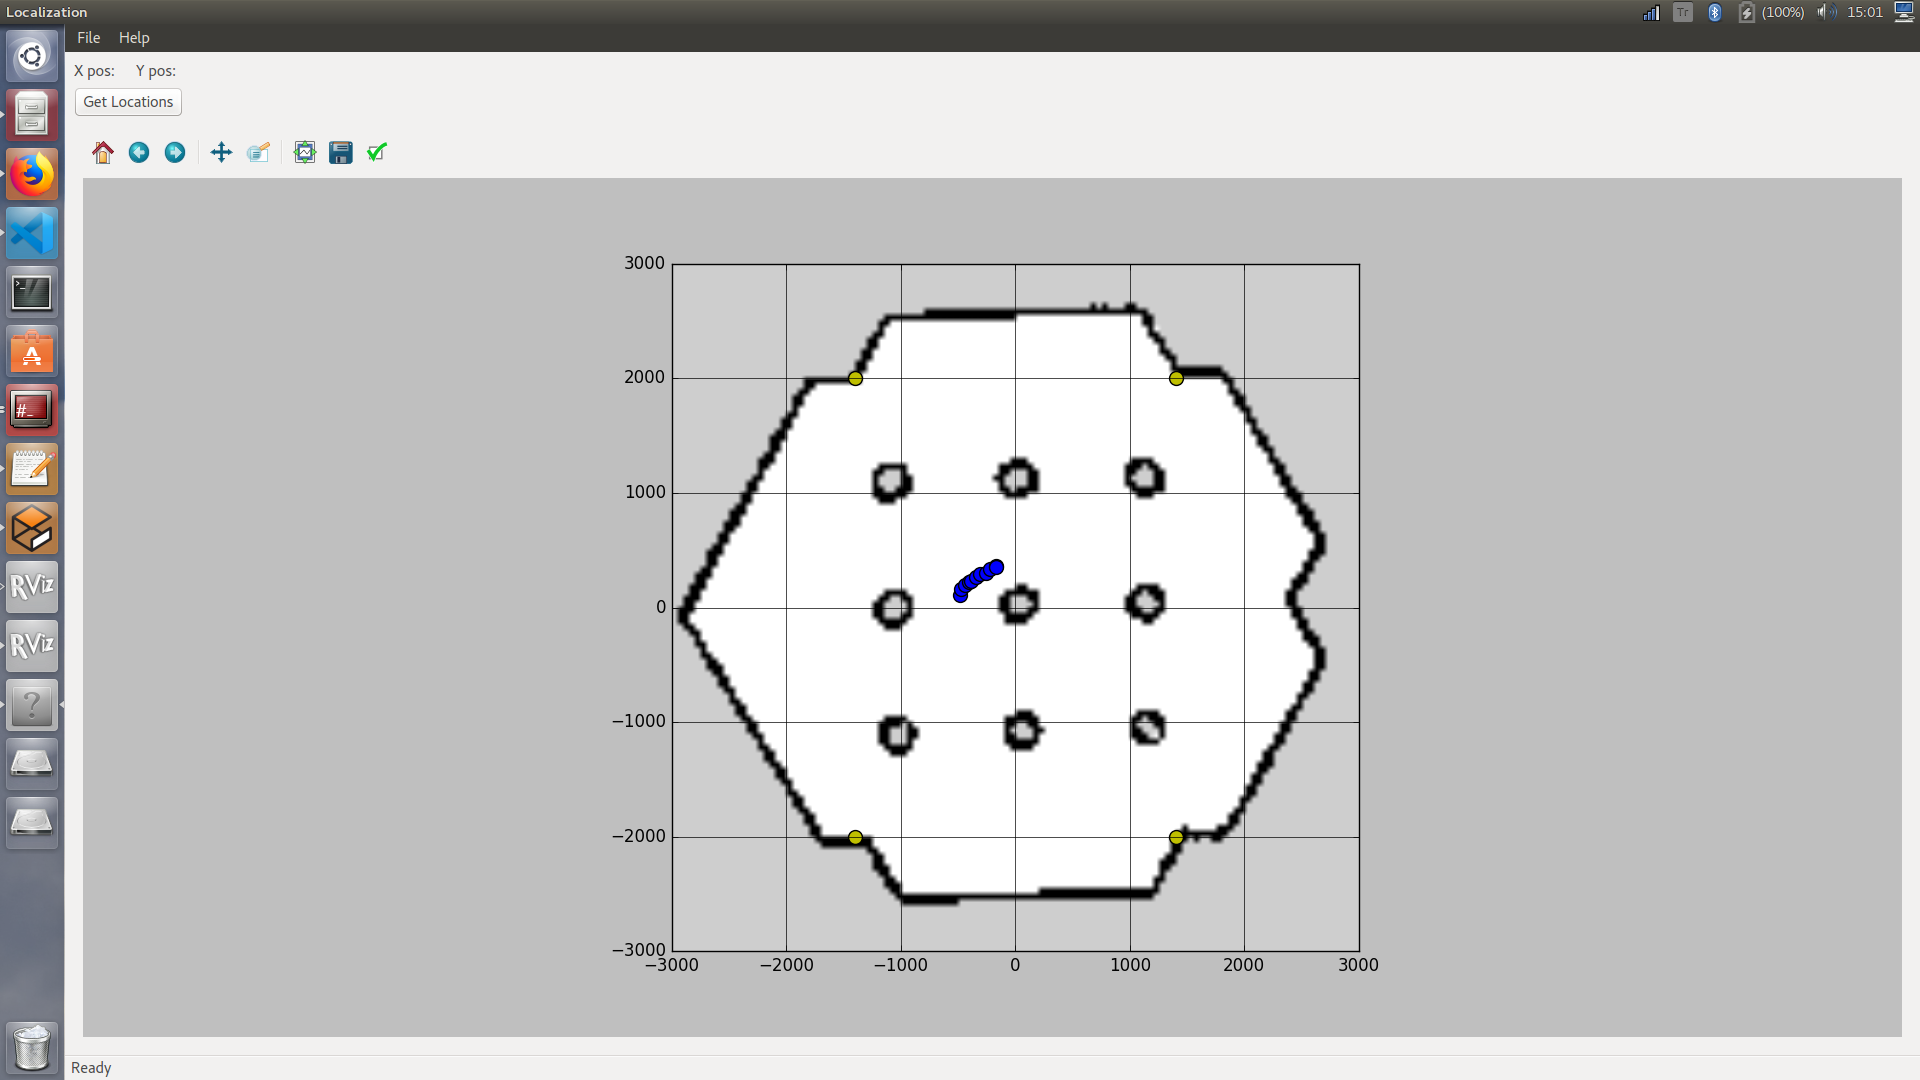
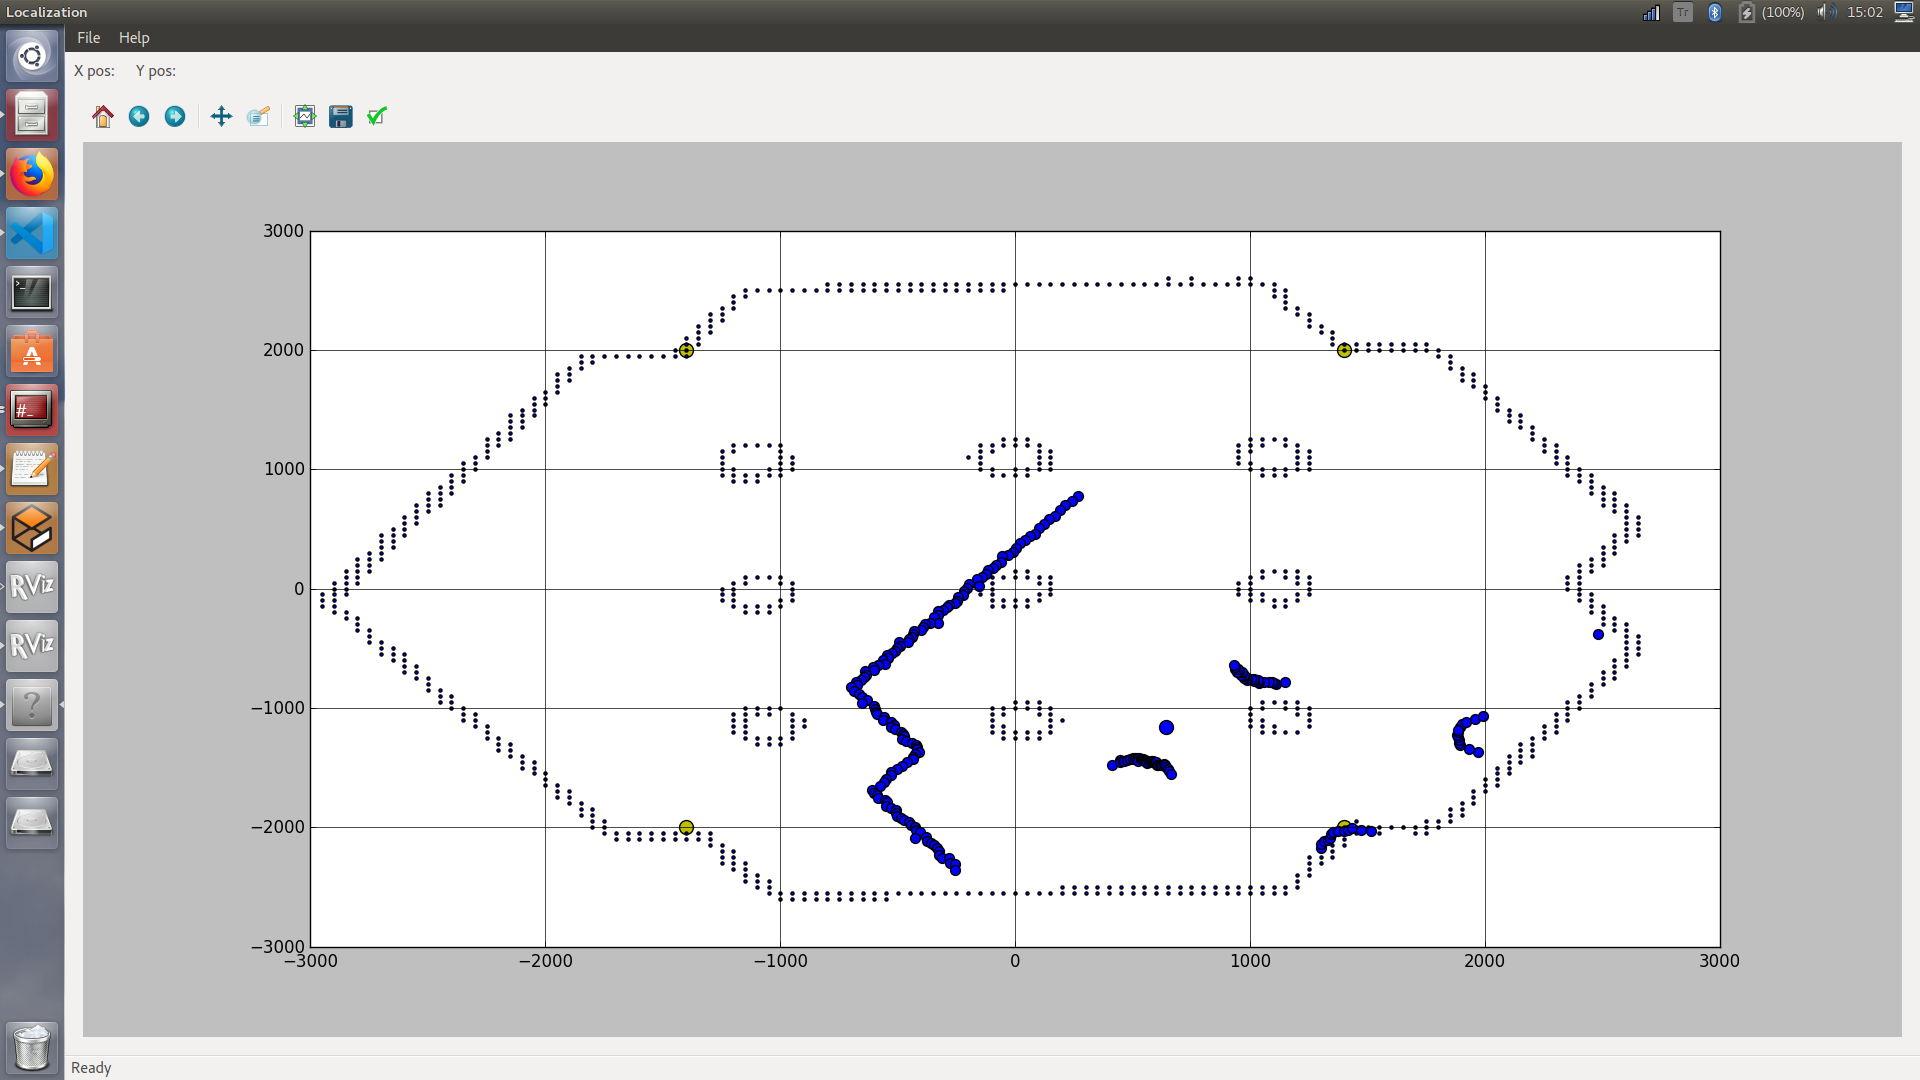
We created 4 different GUI windows to be able to visualise the data that is gathered. These nodes are created with QT, thus you can change widget type. All GUI nodes use different topics which are generated with the python scripts that are located in the ieu_agv project so in order this GUIs to work odom, uwb_data_topic and localization_data_topic messages must exist.
With this GUI you can visualise the output of the localization algorithm on a given map rosrun ieuagv_gui gui_localization_V2.py
This GUI will let you visualise the odometry output rosrun ieuagv_gui gui_odom.py
This GUI will let you send a target position to the navigation stack so navigation algorithm will lead the robot to the designated location rosrun ieuagv_gui gui_goal.py
This will print out the map with the current LiDAR measurements. rosrun ieuagv_gui gui_map.py


