Vebugger is a visual debugging aid that integrates with Eclipse and allows developers to visualize Java objects' state during a paused execution (see some examples below). Vebugger is designed as an Eclipse plugin that uses templates to visualize class instances of a certain Java type. Vebugger includes a dozen templates for popular Java types, but it can also be extended with templates for custom types, as well.
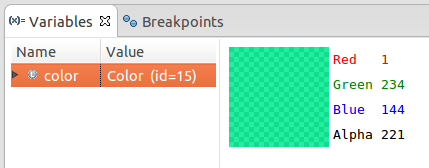
Vebugger's visualization of a Color class instance inside the Variables view of Eclipse's debug perspective.
This visualization exposes the color represented by the object in a fashion more easily comprehensible compared to a textual representation.
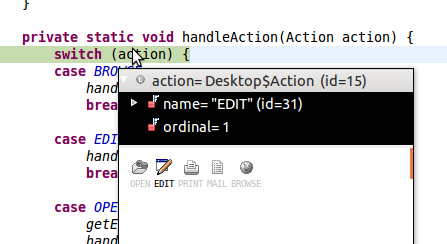
Vebugger's visualization of a Desktop.Action enum instance inside a runtime mouse-over tooltip.
Unlike the textual representation, this visualization exposes the alternative visual states of the enum.
Vebugger's visualization of a Locale instance.
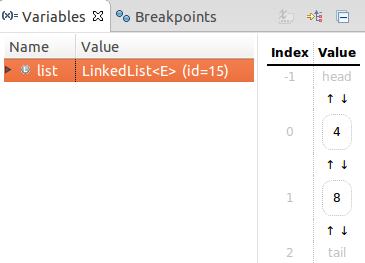
Vebugger's visualization of a LinkedList instance.
- Import the plugin project (
vebugger-eclipse-pluginin the vebugger repository) into your Eclipse workspace and run it as an Eclipse Application. (Note: Please use the latest Eclipse Luna. Other Indigo/Juno are incompatible) - Inside the "inner" Eclipse, import a project that you want to work on, we'll call this the
targetproject. - Also import the Vebugger Aid project (
vebugger-templates-addonin the vebugger repository). - Right click on the
targetproject, select Build Path > Configure Build Path, select the Projects tab and add thevebugger-templates-addonproject - Debug-run the
targetproject. When execution pauses (e.g., a breakpoint is reached) right click on any variable under the Variables view, select Show Details As > Visual Debugger
To add support for a new Java type you will need to add a new template. Templates extend the VebuggerTemplate class. Your template class must be in the vebugger.templates package, but does not have to be inside the vebugger-templates-addon project.


