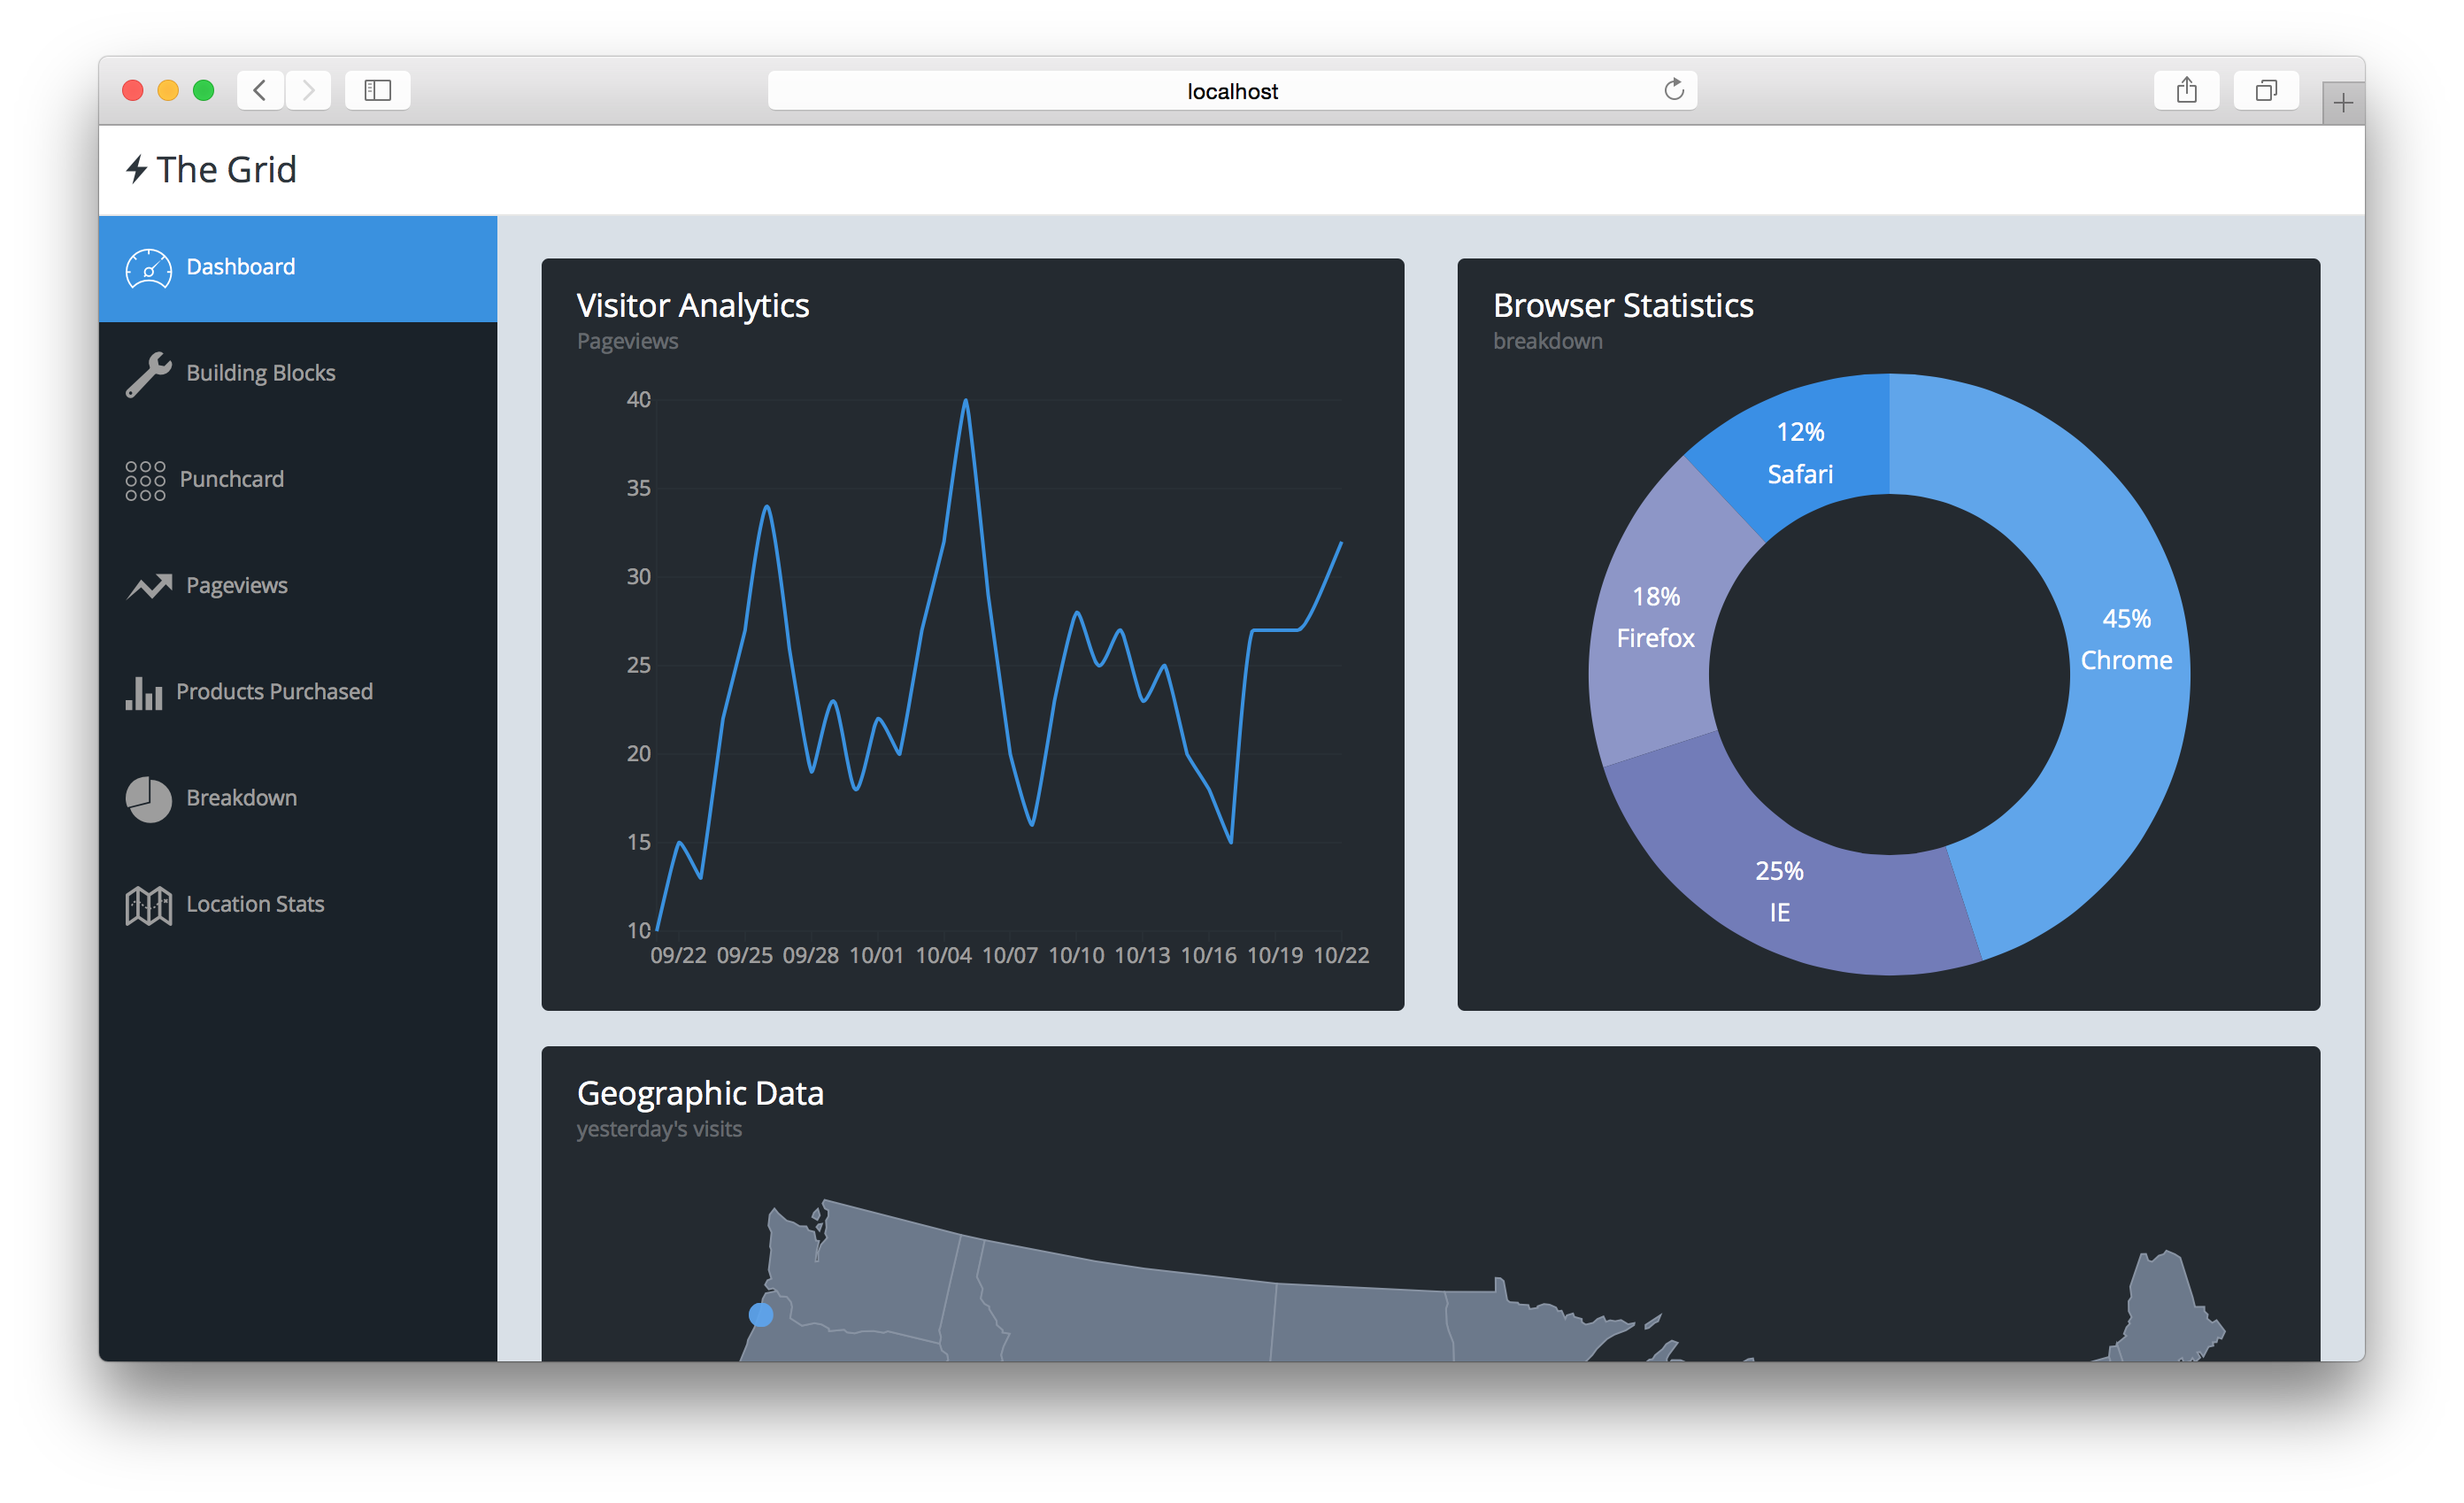
This is a class I took on D3.js. It was a great refesher and I learned some new topics. The instructor actually provided some of the framework, but as excercise we were to build out charts. There are two more I need to complete for homework.
Demo analytics dashboard used in a full-day workshop on D3.js!
First of all, make sure you have Git and Node installed. Then, follow these instructions in a command prompt:
$ npm install -g browser-sync
$ git clone https://github.com/victormejia/d3-workshop-playground.git
$ cd d3-workshop-playground
$ browser-sync start --server --files "**/*"
It should launch your default browser and you should see the following:
If you're curious to what we're going to build, append /complete to your url.

